Excel All-in-One Dashboard and Data Management
Objective
Objective:
To improve efficiency in managing sales and inventory data by centralizing data visualization, input processes, and real-time insights within a single Excel file.
- Streamline data entry and analysis to reduce errors and time spent on manual tasks.
- Provide actionable insights into sales performance, inventory levels, customer behavior, and marketing effectiveness.
Challenges
Challenges:
- Manual data entry and analysis were time-consuming and prone to errors.
- Lack of centralized data visualization and automated reporting slowed decision-making processes.
Methodology
Methodology followed these steps:
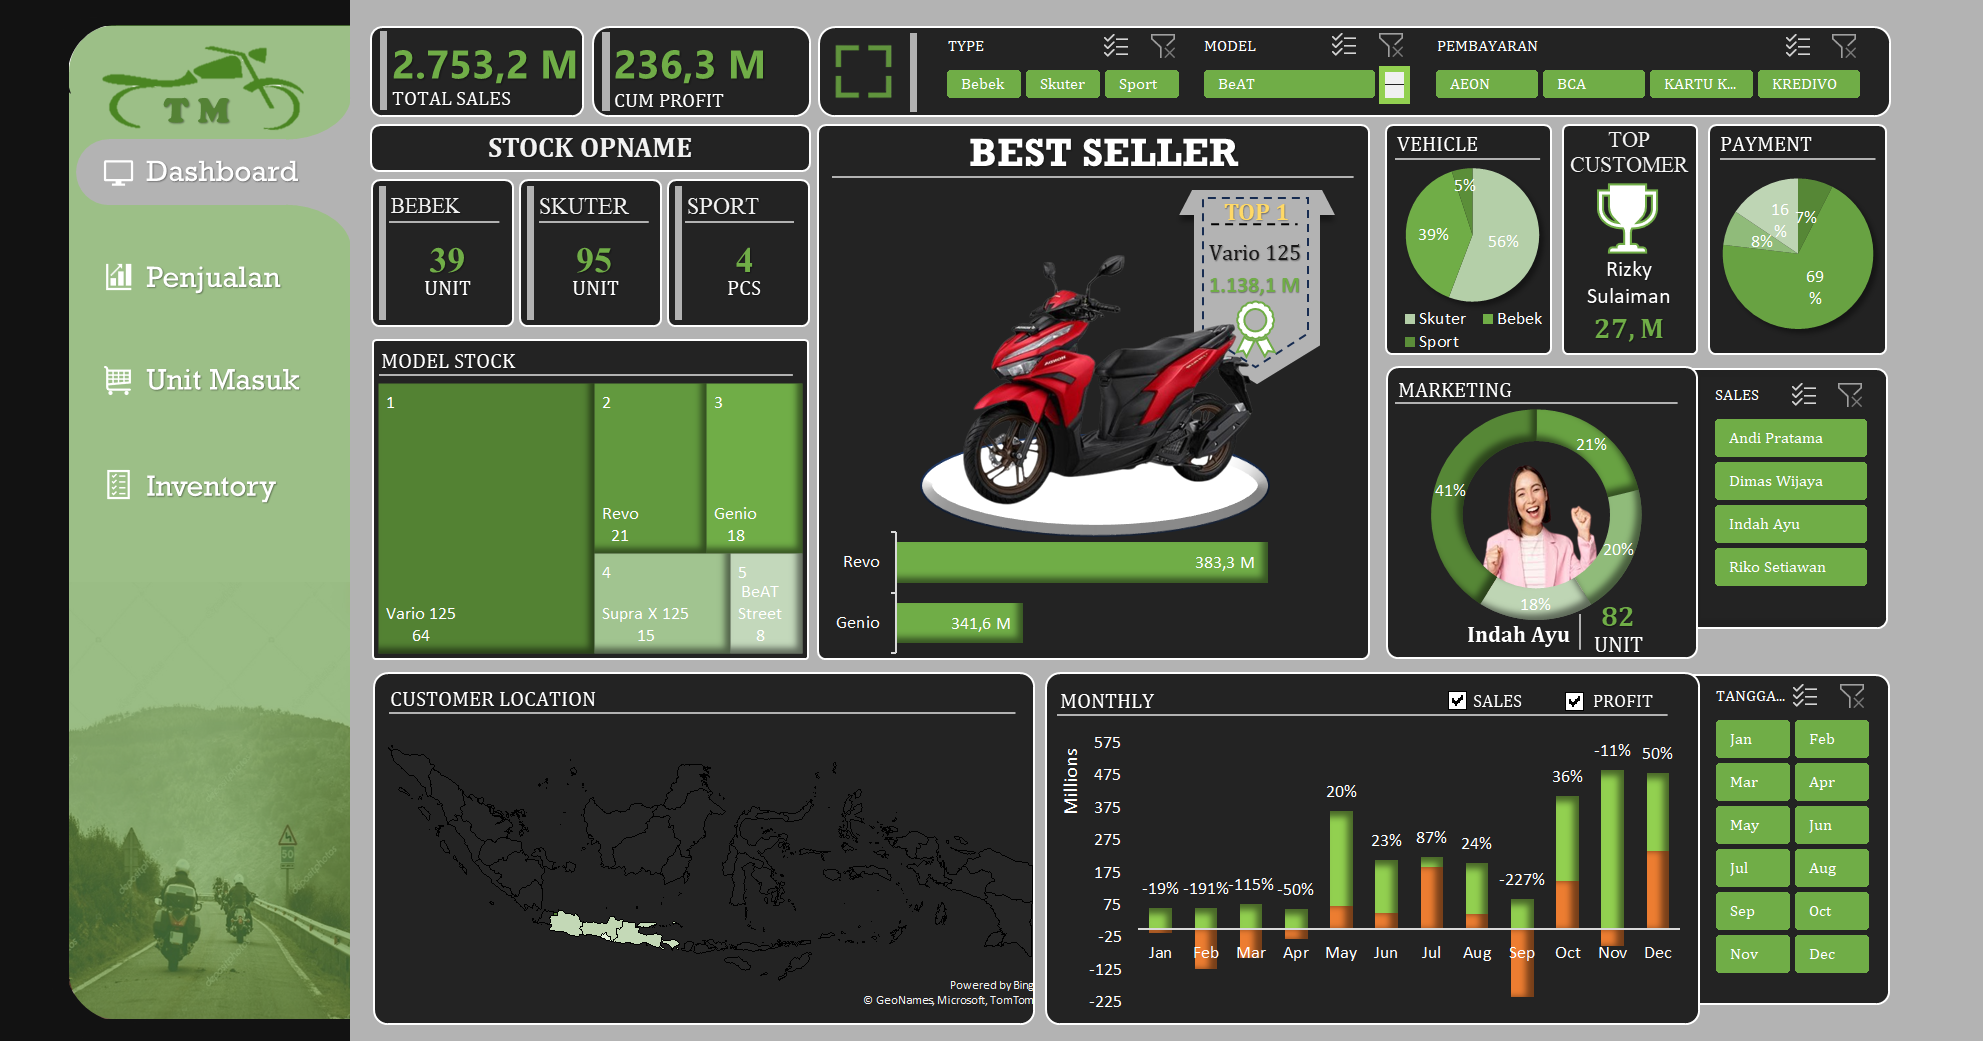
1. Dashboard Creation: Developed an interactive dashboard using Microsoft Excel to centralize sales and inventory data.
2. Automation with Macros: Integrated macros for interactivity and automation, improving the user experience and reducing the need for manual updates.
3. Data Aggregation & Visualization: Aggregated sales and inventory data to power visualizations and insights, allowing for easy analysis.
4. Dynamic Filters: Added filters to customize the dashboard views, enabling filtering by product type, payment methods, and time periods.
Analysis
Identified the following key insights:
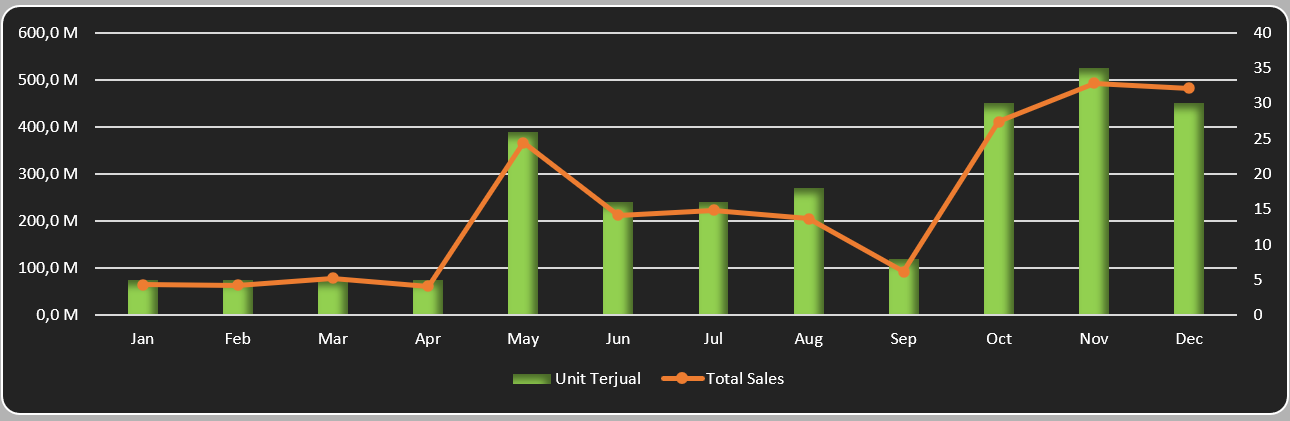
1. Sales Performance: Visualized sales and profit data to monitor trends and track performance.
2. Inventory Management: Streamlined stock level tracking and automated inventory reports for better decision-making.
3. Customer & Marketing Insights: Integrated customer behavior and marketing effectiveness metrics, enabling targeted decision-making.